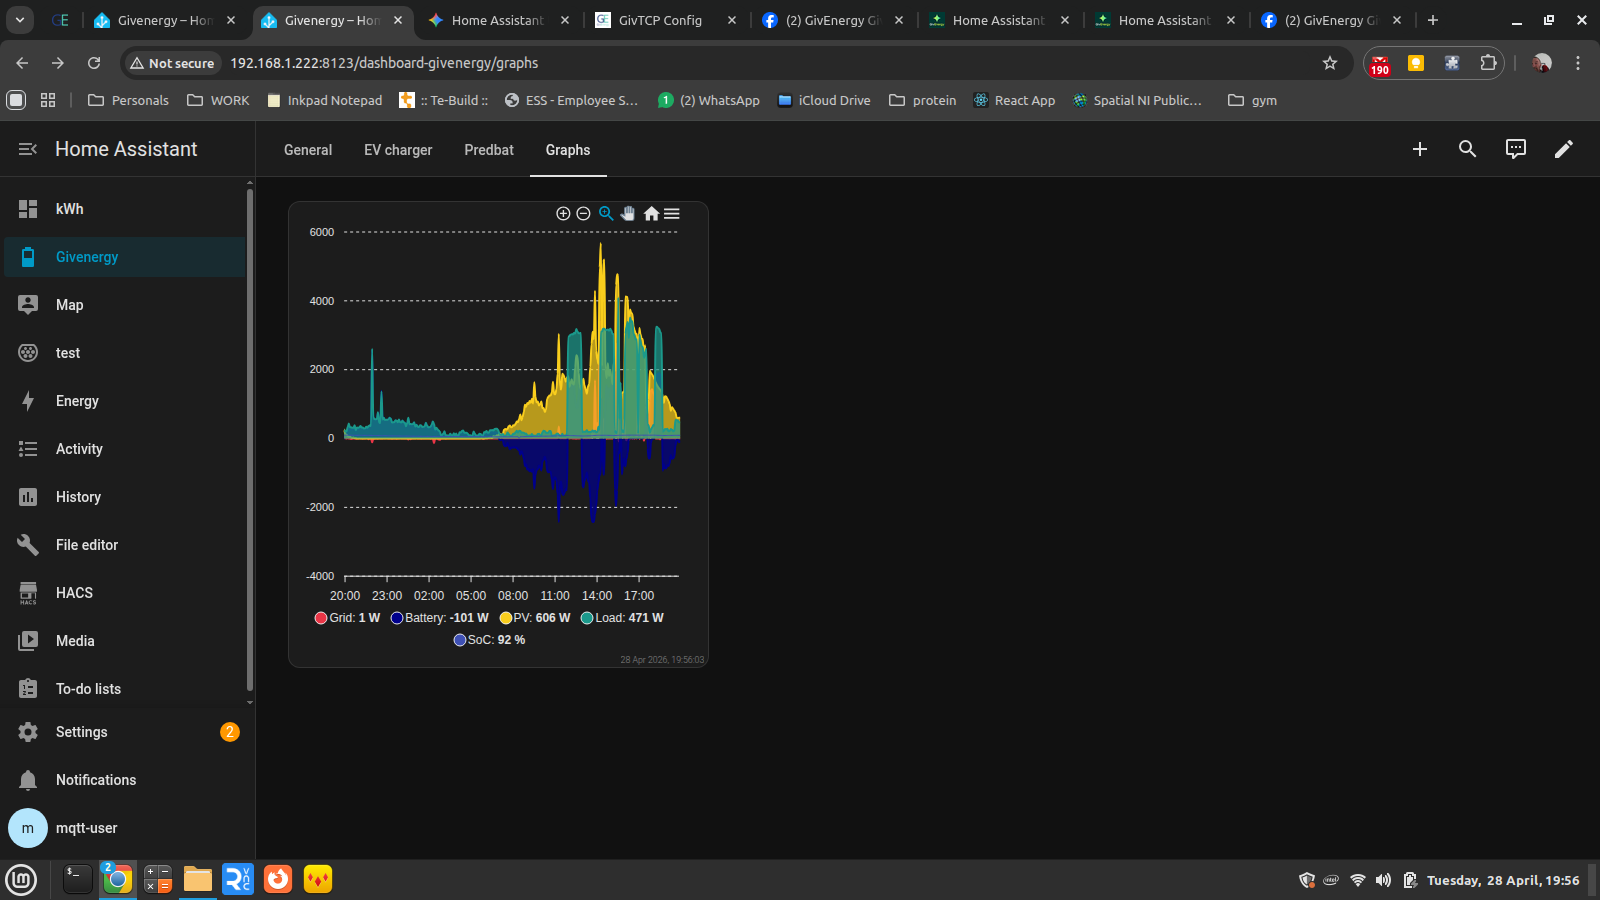
Has anyone created a replica on Home Assistant of the Givenergy Power Graph? I’ve seen one once but no code provided and I cant figure out where it was to ask them.
1 Like
Try this
type: custom:apexcharts-card
experimental:
  color_threshold: true
header:
  show: false
  floating: false
  title: "19D: Last 24h"
graph_span: 24h
show:
  last_updated: true
  loading: true
apex_config:
  chart:
    zoom:
      type: x
      enabled: true
      autoScaleYaxis: false
    toolbar:
      show: true
      autoSelected: zoom
    xaxis.type: datetime
series:
  - entity: sensor.gw_xxxxxxx_grid_power
    type: area
    name: Grid
    yaxis_id: power
    color: EA3546
    group_by:
      func: last
      duration: 5m
    stroke_width: 2
    extend_to: now
    show:
      extremas: false
      header_color_threshold: true
  - entity: sensor.gw_xxxxxxx_battery_power
    type: area
    name: Battery
    yaxis_id: power
    color: darkblue
    group_by:
      func: last
      duration: 5m
    stroke_width: 2
    extend_to: now
    show:
      extremas: false
      header_color_threshold: true
  - entity: sensor.gw_xxxxxxxx_pv_power
    type: area
    name: PV
    yaxis_id: power
    group_by:
      func: last
      duration: 5m
    color: f9ce1d
    stroke_width: 2
    extend_to: now
  - entity: sensor.gw_xxxxxxxx_load_power
    type: area
    name: Load
    yaxis_id: power
    group_by:
      func: last
      duration: 5m
    color: 1B998B
    stroke_width: 2
    extend_to: now
  - entity: sensor.gw_xxxxxxxx_soc
    type: line
    name: SoC
    yaxis_id: soc
    color: 3f51b5
    group_by:
      func: last
      duration: 5m
    stroke_width: 1
    extend_to: now
    show:
      extremas: false
      header_color_threshold: true
yaxis:
  - id: power
    align_to: 1
    min: ~6
    max: ~6
    apex_config:
      tickAmount: 18
  - id: soc
    min: 0
    max: 100
    opposite: true
    apex_config:
      tickAmount: 10
4 Likes
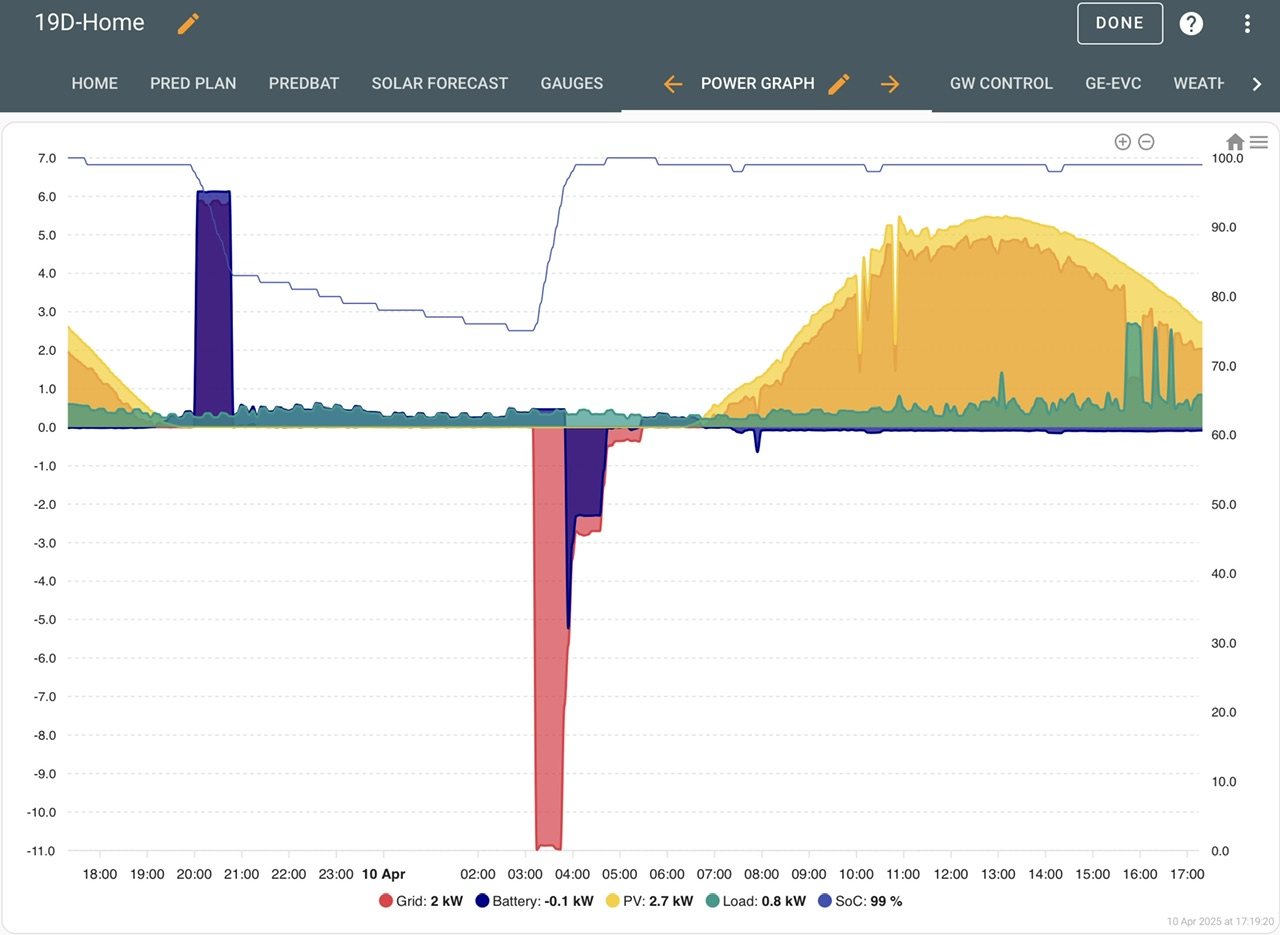
Hat tip to @TheDragon
1 Like
That… is a nice graph ![]()
1 Like
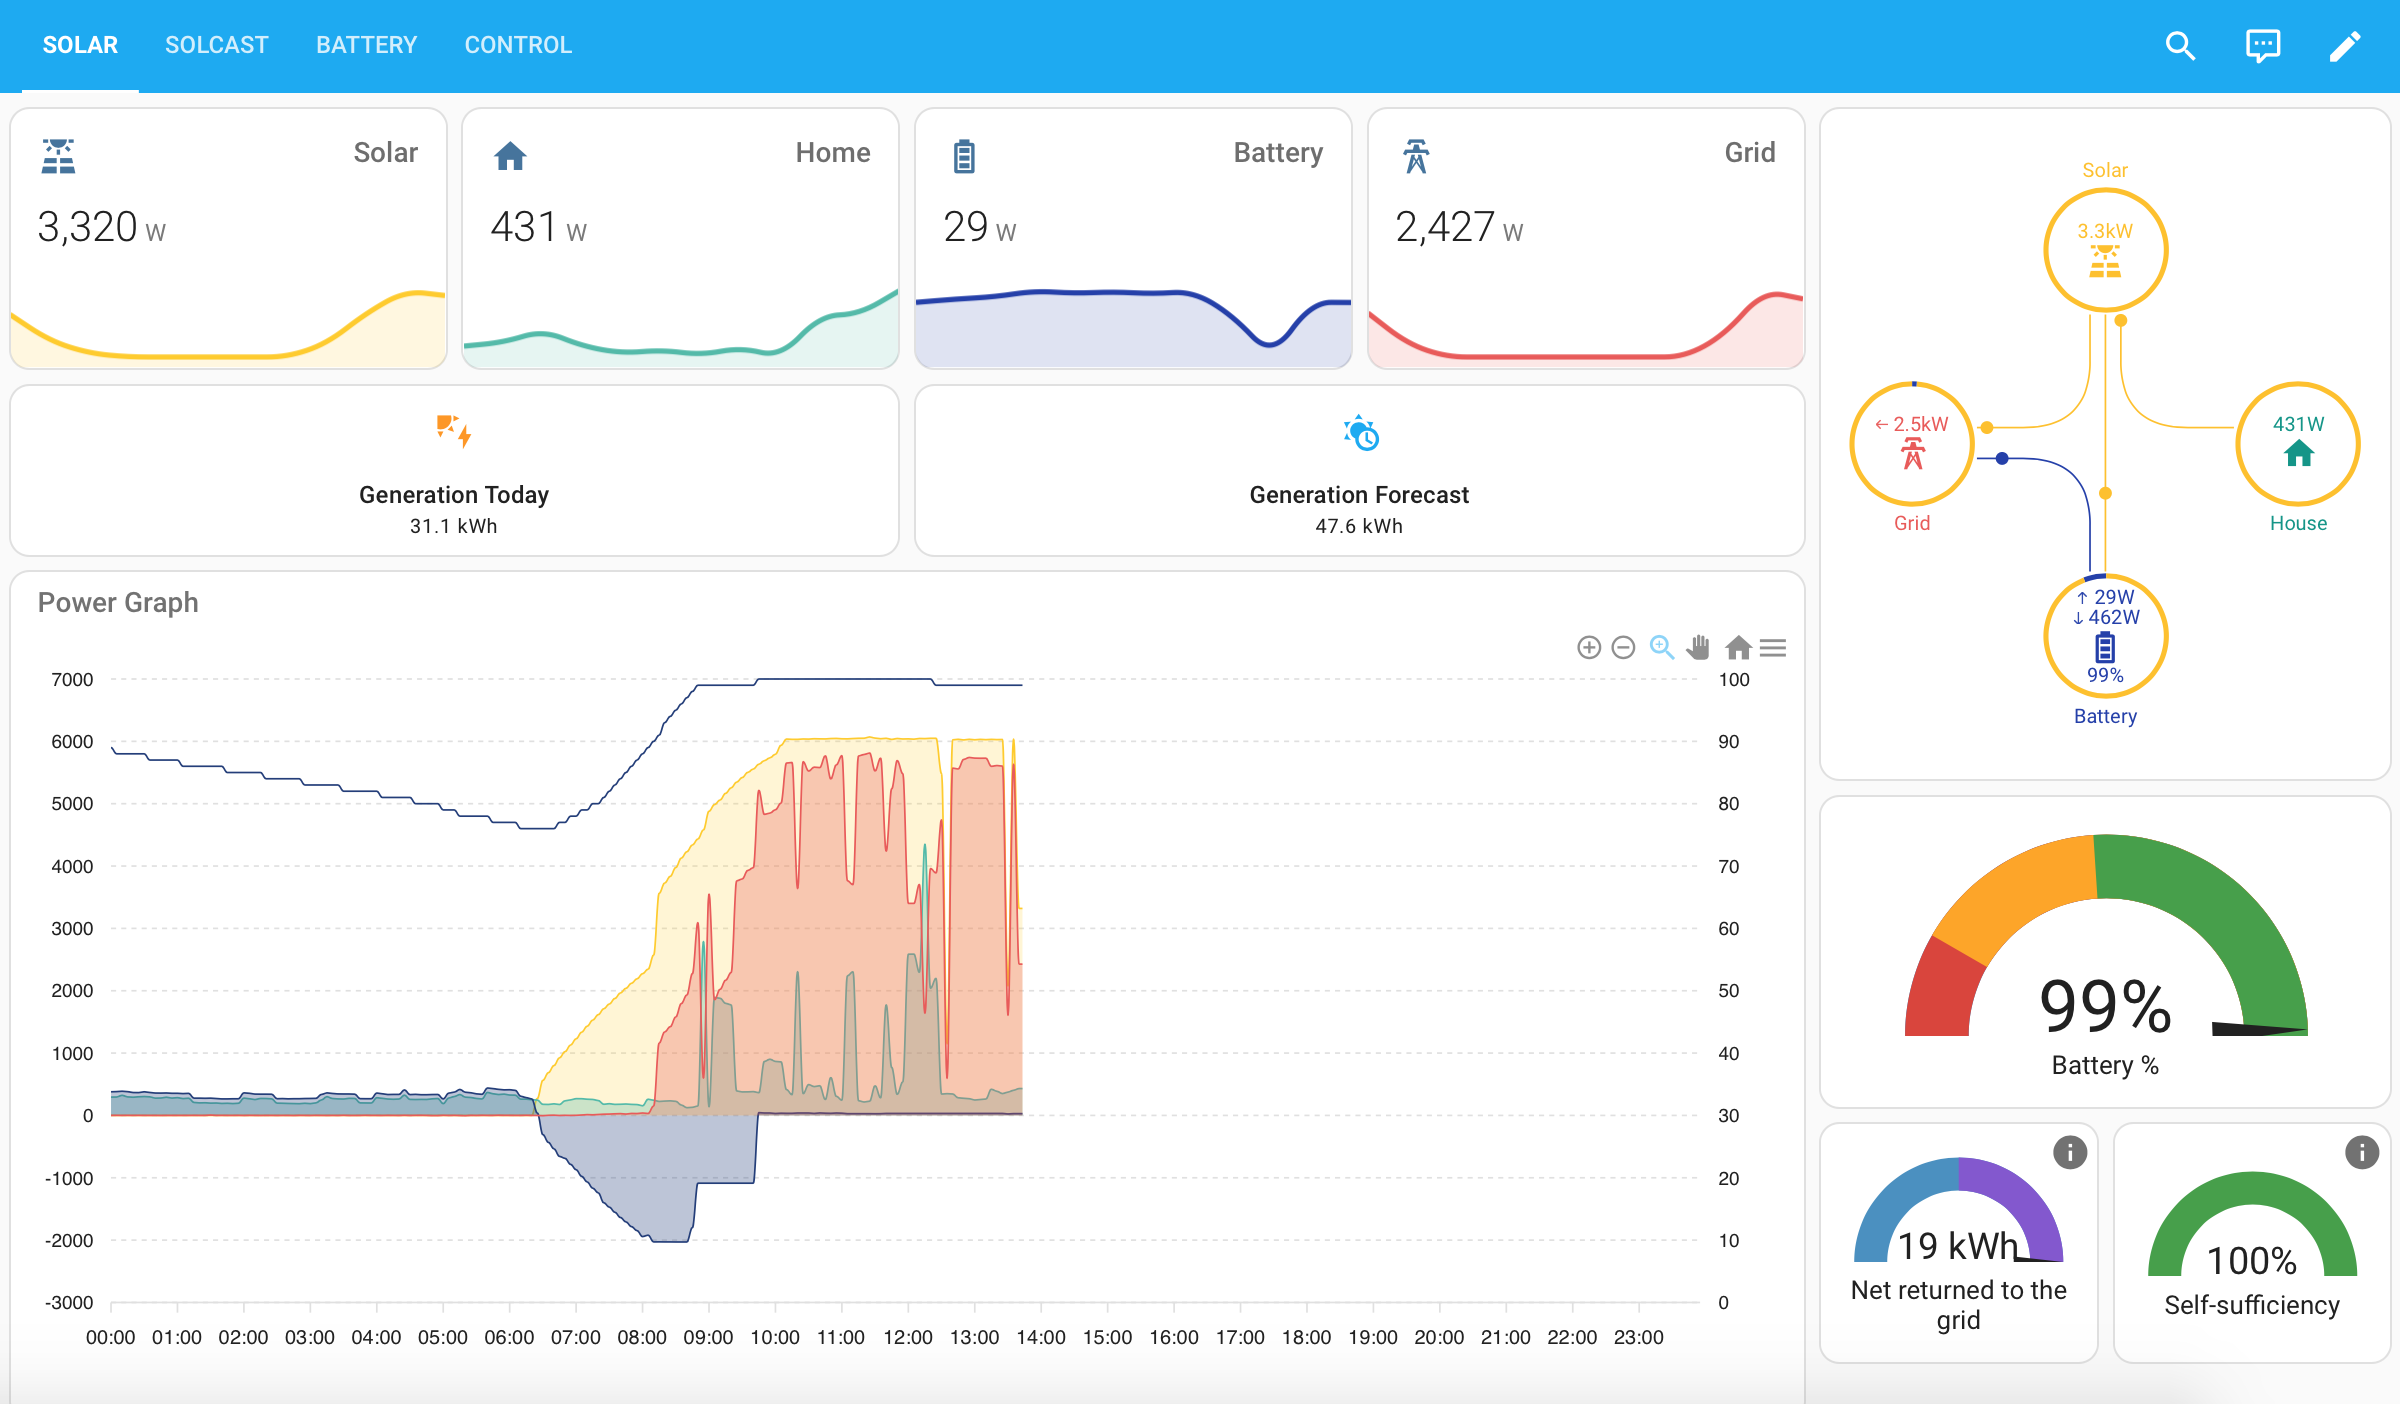
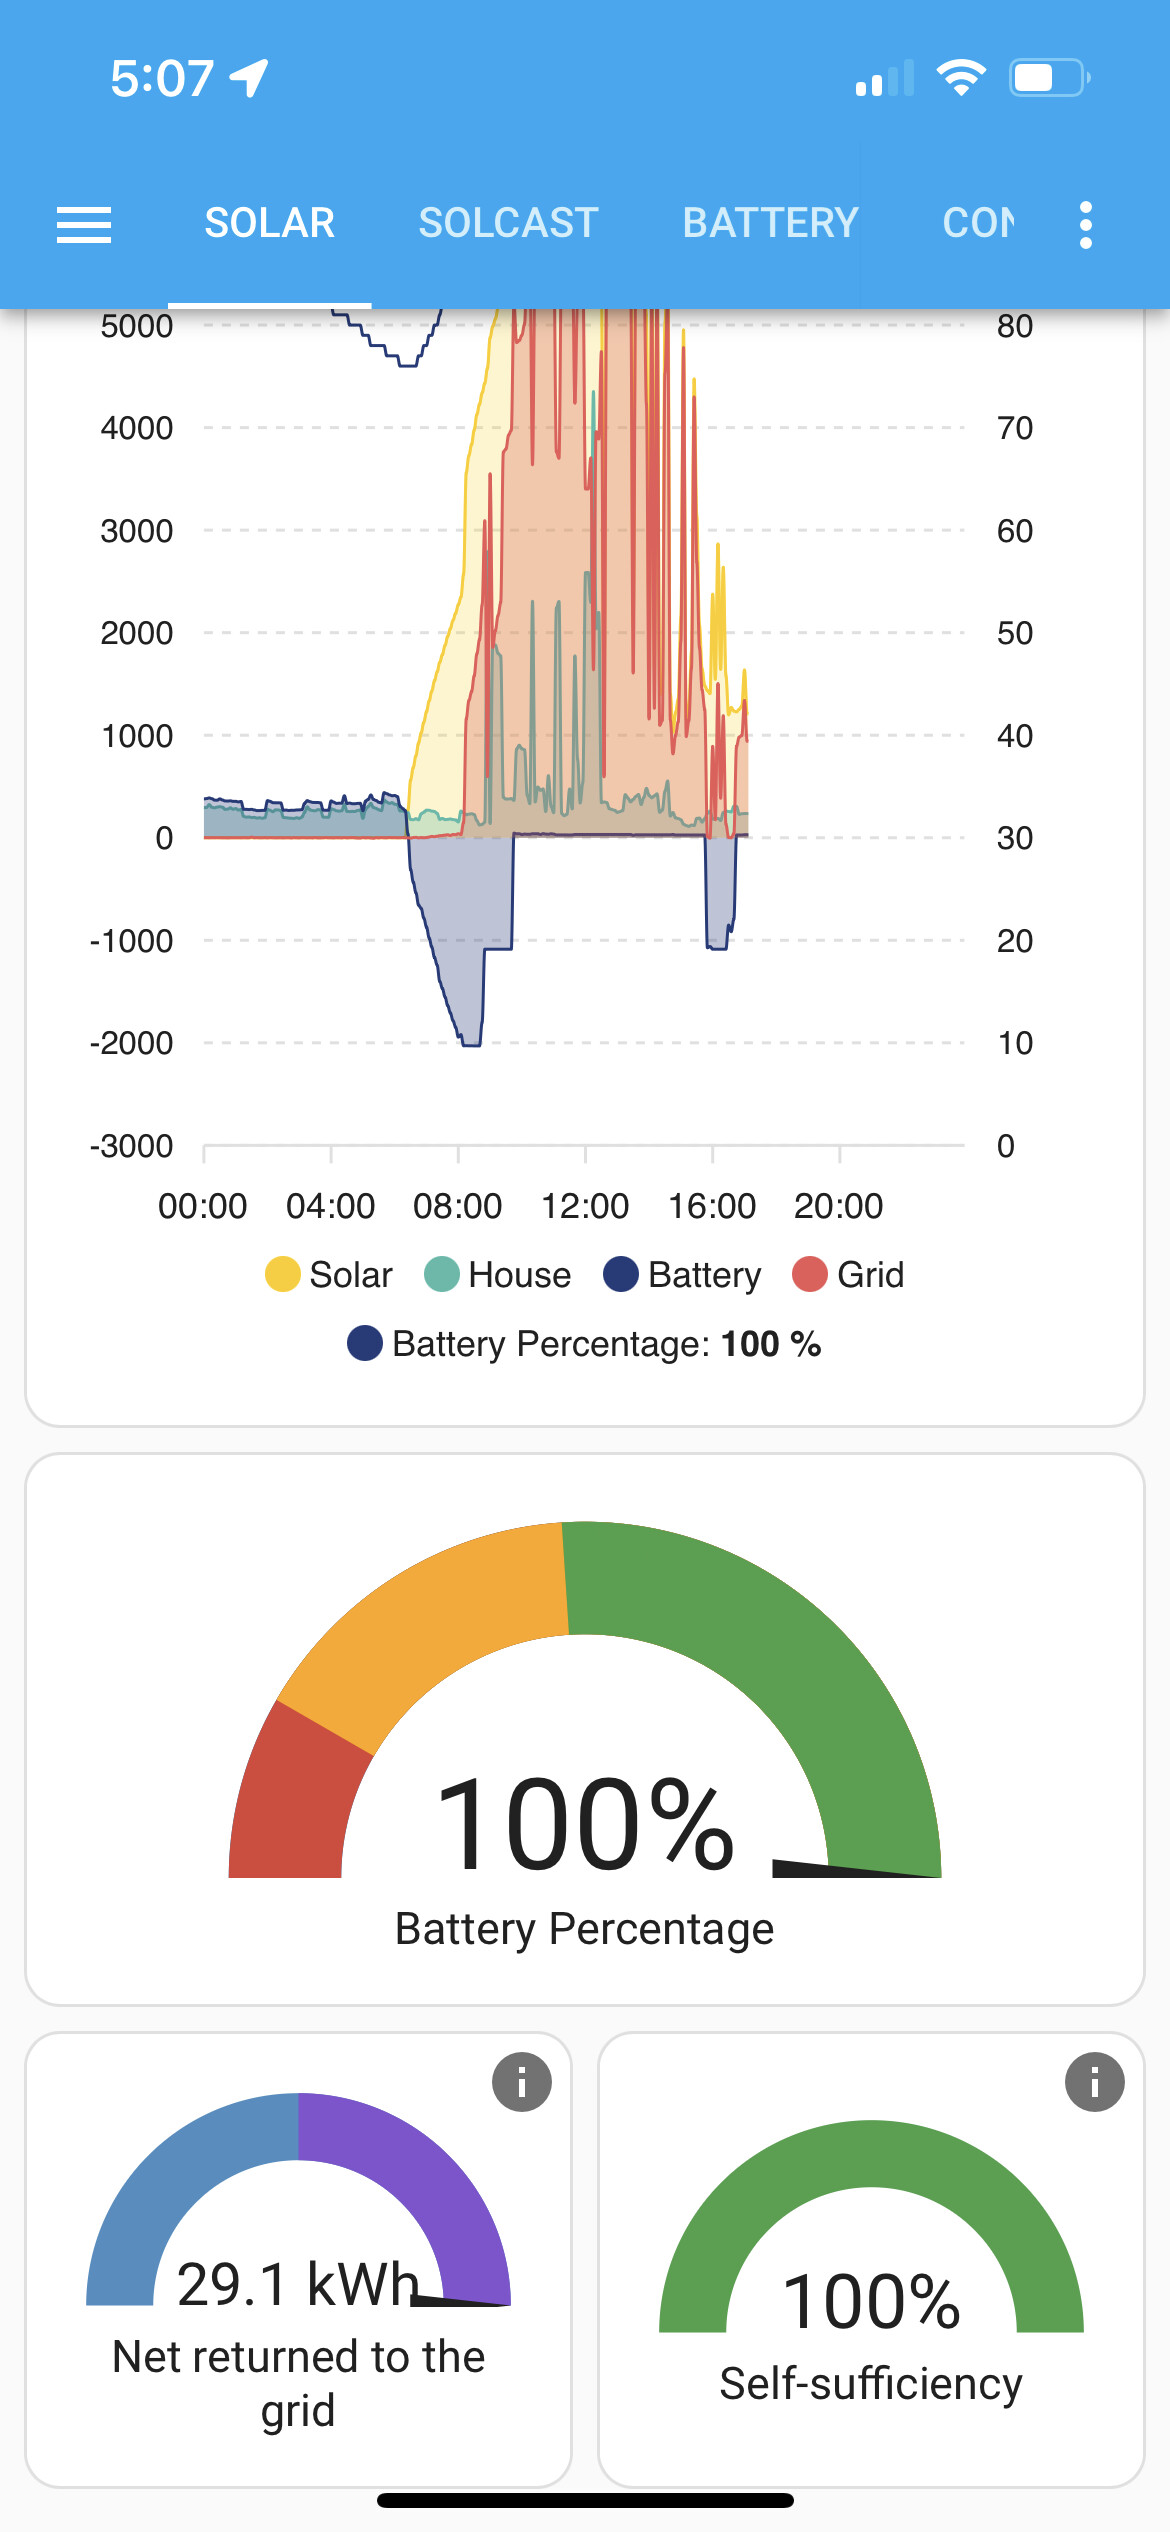
I’ve tweaked the graph to make it look more like the mobile app version (which I prefer) but also adjusted a few bits to improve contrast. Also added caching to speed things up and changed the layer order. Other improvements like removing the latest values from the legend
type: custom:apexcharts-card
cache: true
experimental:
  color_threshold: true
header:
  show: true
  title: Power Graph
graph_span: 24h
span:
  start: day
show:
  last_updated: false
  loading: false
apex_config:
  chart:
    height: 450px
    zoom:
      type: x
      enabled: true
    toolbar:
      show: true
      autoSelected: zoom
  xaxis:
    type: datetime
series:
  - entity: sensor.givtcp_XXXXXXX_pv_power
    name: Solar
    type: area
    opacity: 0.2
    color: "#FFCC01"
    yaxis_id: power
    unit: W
    stroke_width: 1
    extend_to: now
    group_by:
      func: last
      duration: 5m
    show:
      legend_value: false
  - entity: sensor.givtcp_XXXXXXX_load_power
    name: Home
    type: area
    opacity: 0.3
    color: "#4FBBA9"
    yaxis_id: power
    unit: W
    stroke_width: 1
    extend_to: now
    group_by:
      func: last
      duration: 5m
    show:
      legend_value: false
  - entity: sensor.givtcp_XXXXXXX_battery_power
    name: Battery
    type: area
    opacity: 0.3
    color: "#233C7B"
    yaxis_id: power
    unit: W
    stroke_width: 1
    extend_to: now
    group_by:
      func: last
      duration: 5m
    show:
      legend_value: false
  - entity: sensor.givtcp_XXXXXXX_grid_power
    name: Grid
    type: area
    opacity: 0.3
    color: "#EA5A56"
    yaxis_id: power
    unit: W
    stroke_width: 1
    extend_to: now
    group_by:
      func: last
      duration: 5m
    show:
      legend_value: false
  - entity: sensor.givtcp_XXXXXXX_soc
    name: Battery Percentage
    type: line
    color: "#233C7B"
    yaxis_id: soc
    stroke_width: 1
    extend_to: now
    group_by:
      func: last
      duration: 5m
yaxis:
  - id: power
    align_to: 1000
    min: ~6000
    max: ~6000
    decimals: 0
    apex_config:
      tickAmount: 10
  - id: soc
    min: 0
    max: 100
    decimals: 0
    opposite: true
    apex_config:
      tickAmount: 10
4 Likes
I also used the ‘viability’ options to have it show the mini charts on larger devices and individual cards in a grid on smaller ones.
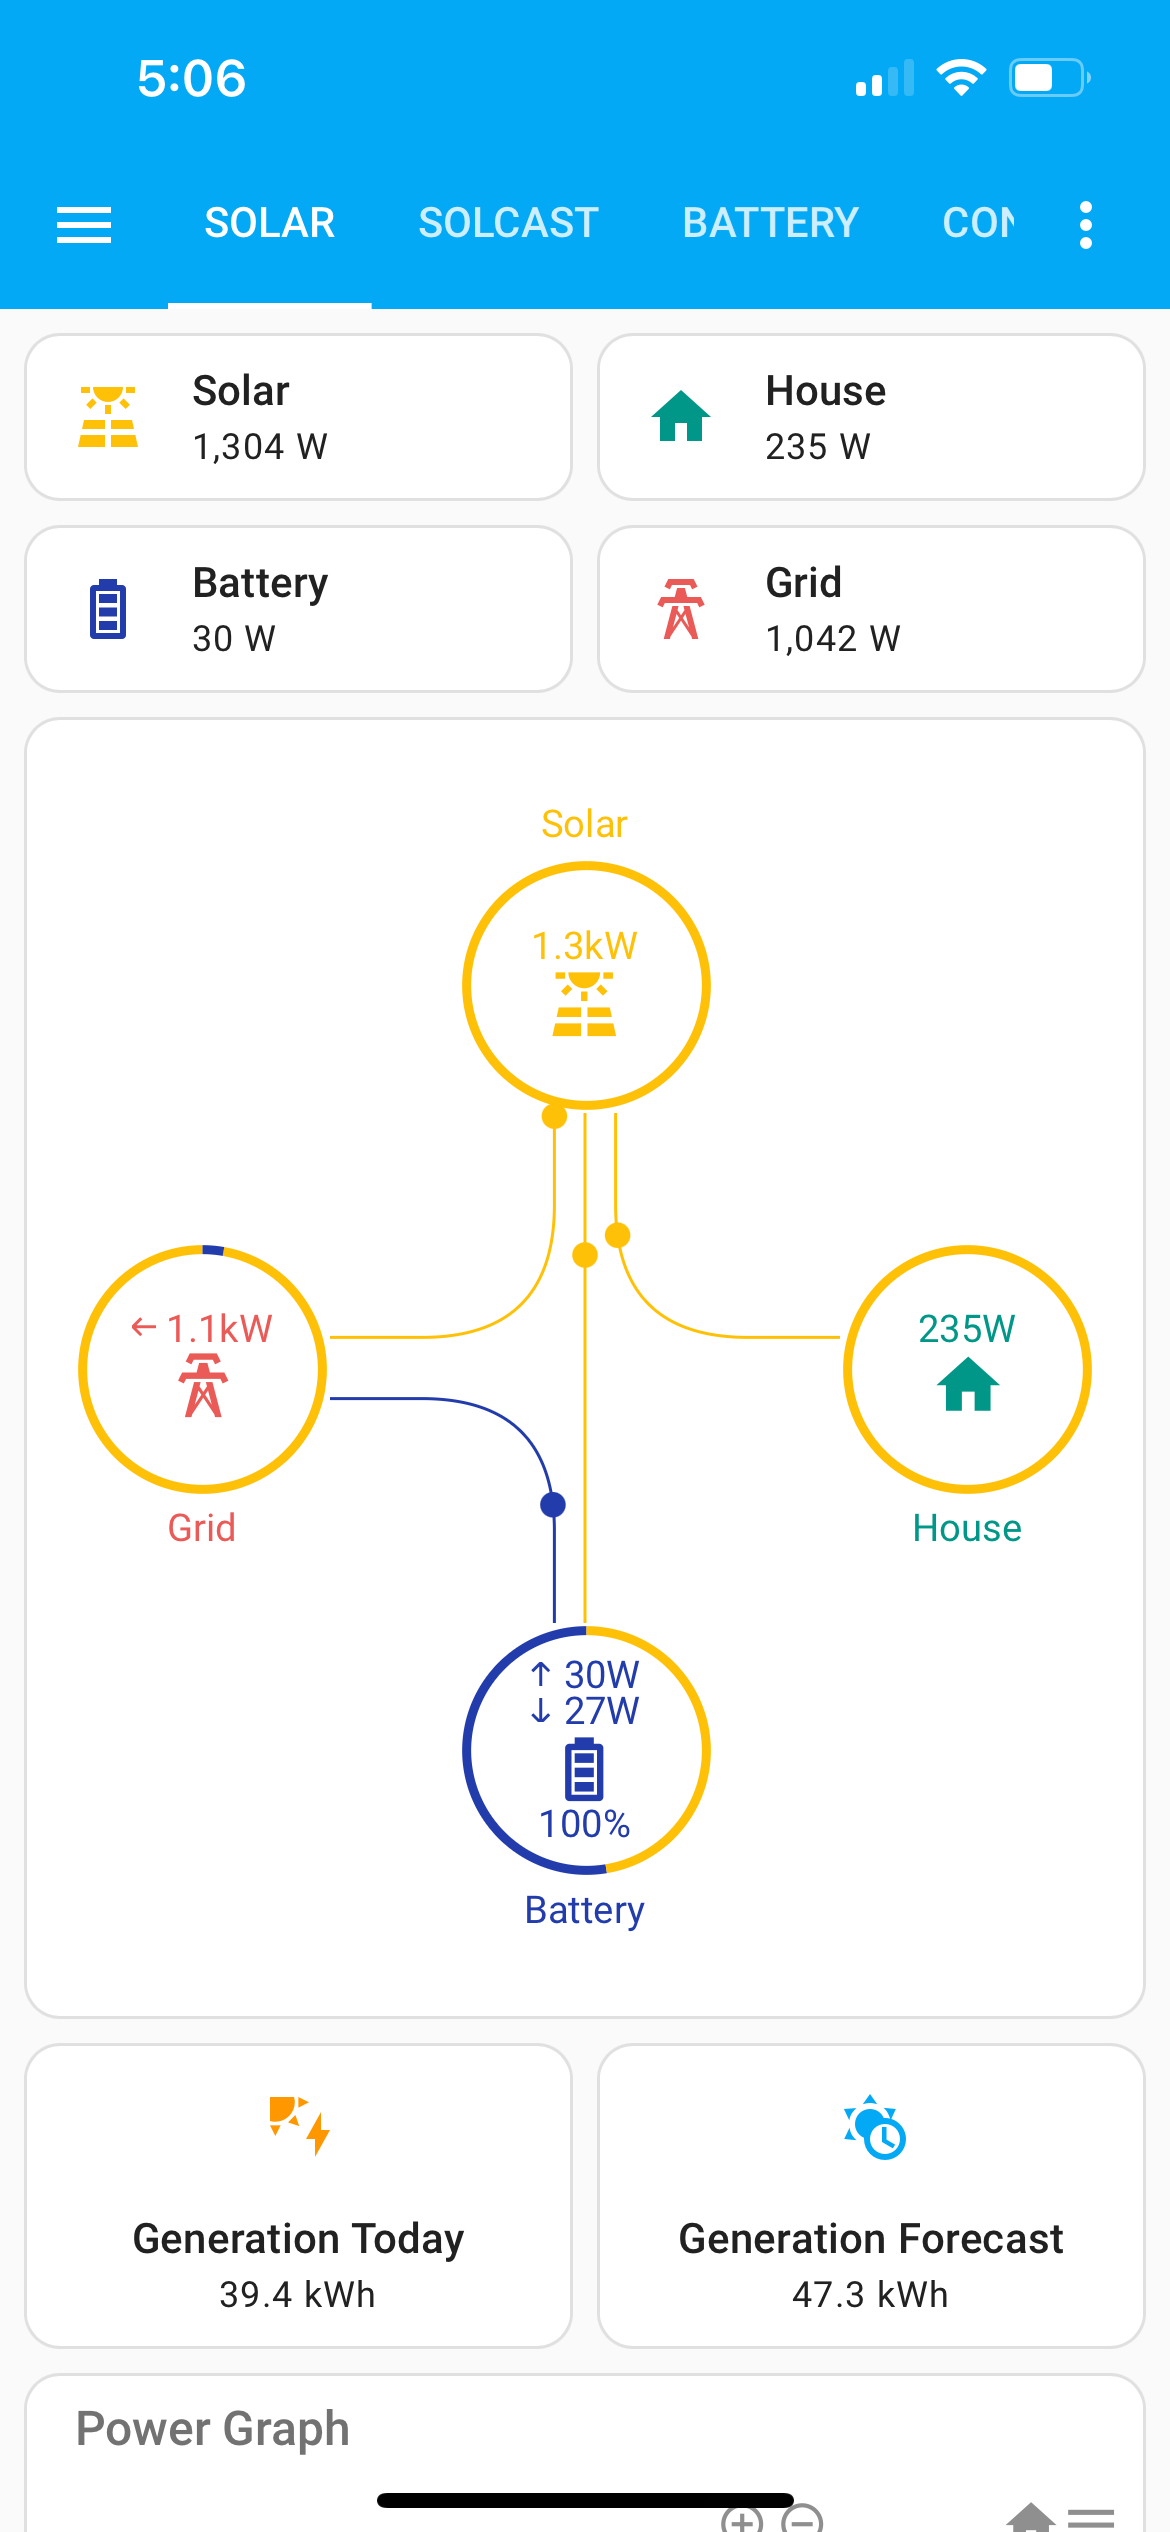
3 Likes
Superb thanks
1 Like