This question doesn’t have anything to do with my GivEnergy system (I think) but I wonder if anyone can comment on my home power consumption pattern.
During the night (20:30 to 08:30) my home’s power consumption ticks over at about 200w at any one time. During the day (08:30 to 20:30) it rises to about 600w (ovens and kettles etc aside). This pattern is very consistent. I have no idea why the increase during the day. There’s nothing I can think of that consistently comes on at 08:30 to increase the load.
Any ideas?
Lights, TV,PCs, opening fridge/freezer door(starting compressor), boiler/heating pumps.
Thanks for reply - but none of that explains the clear and consistent increase in load at (almost) exactly 08:30.
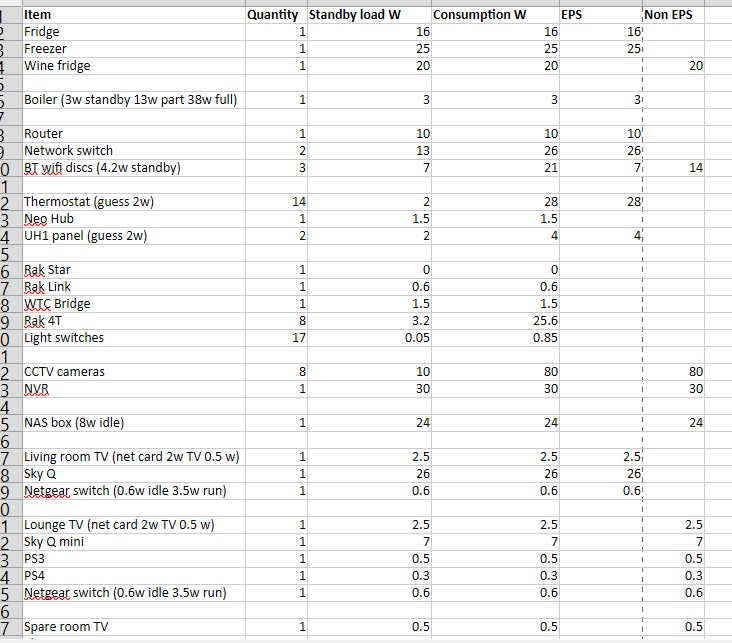
I did a spreadsheet of everything I could find in the house to find my base load as I could not believe 600w that was showing (extract snip here). You may just have to work through a process of elimination through everything.
ing
Wow. What a comprehensive piece of work. I must say that I haven’t yet stretched to wine fridge! But thanks for sharing.
Of all the items that you’ve recorded have you found a pattern in your overall load where there’s a ‘step up’ during the day and a ‘step down’ in the evening?
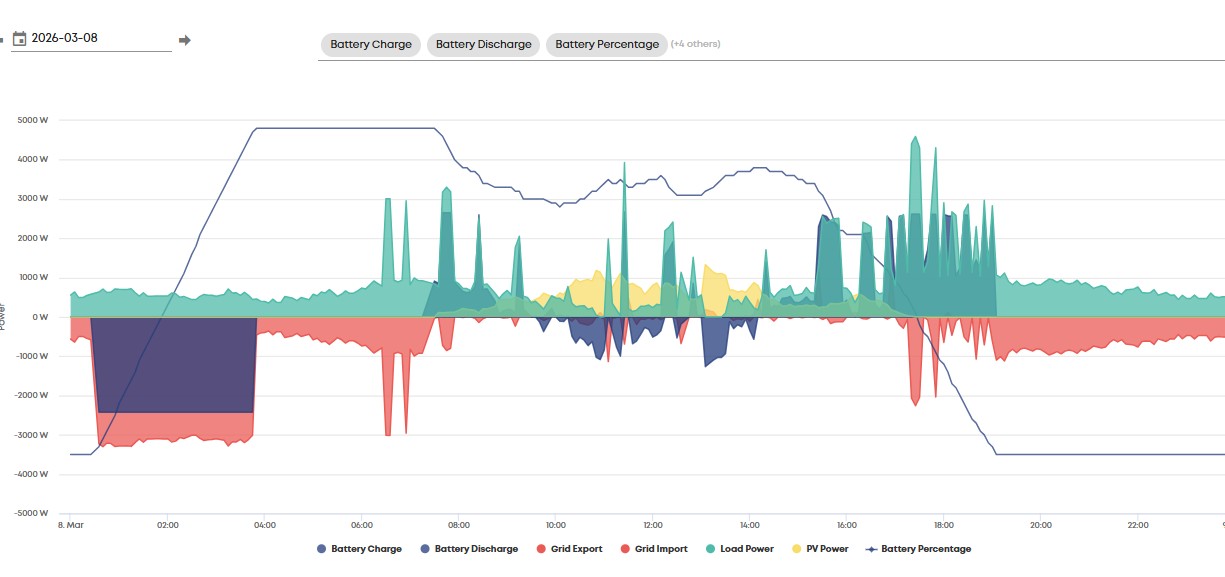
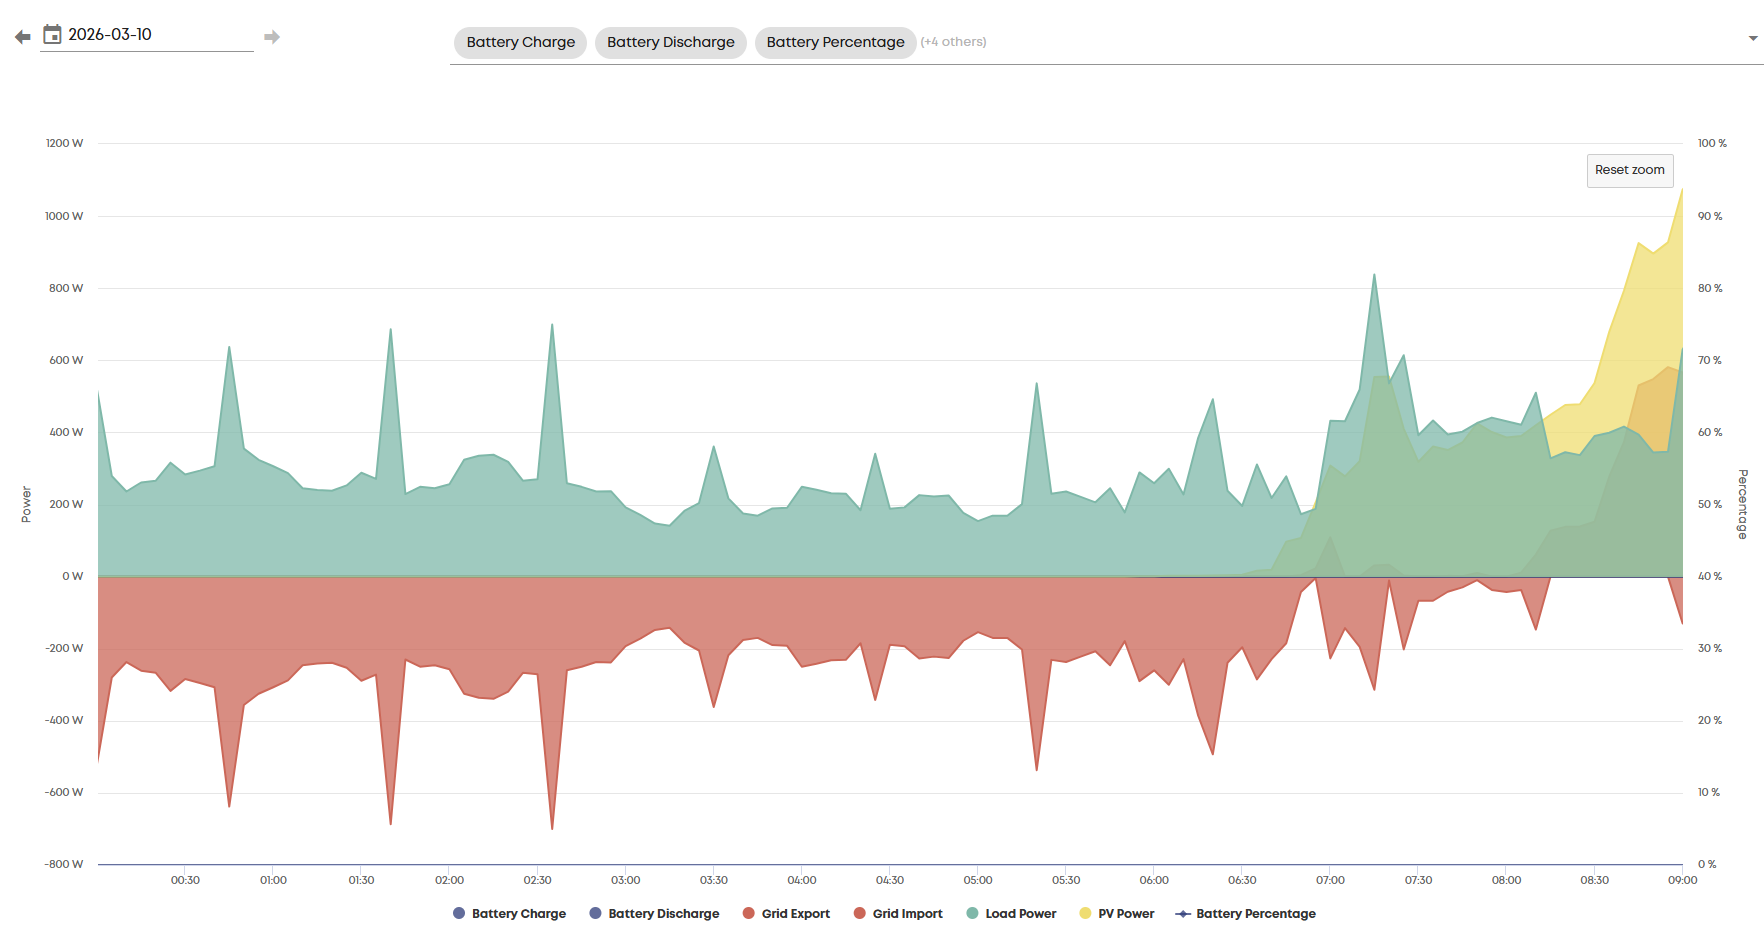
I have Gen1 Hy 5.0 and 9.5 battery. I use HA and predbat. My consumption is pretty flat and pretty much all accountable. We have a Quooker hot tap and can see where that spikes on and things like dishwasher pull on the battery (if there is capacity still there - getting better with lots of sun). You can see the morning cups of tea spikes.
How are you measuring this consumption?
Is it an EM115 and is it fitted the correct way round. Do you have PV and is it actually measuring export as the sun comes up?
Do you have an electric immersion heater?
Are you on any sort of smart tariff?
Hi Hollytree, Thanks so much for your interest in my query but now I have to make a confession…
I’ve just discovered the reason for my strange power use pattern and it’s something I should have alighted on much sooner. I have a dehumidifier in an outside storeroom that’s on a timer! I’d completely forgotten it was still running. And not just running, but running all day long! It’s not running now.
So at least I’ve learned that the data provided by the system can encourage us to look at what power were wasting.
Thanks.
1 Like
Well done.
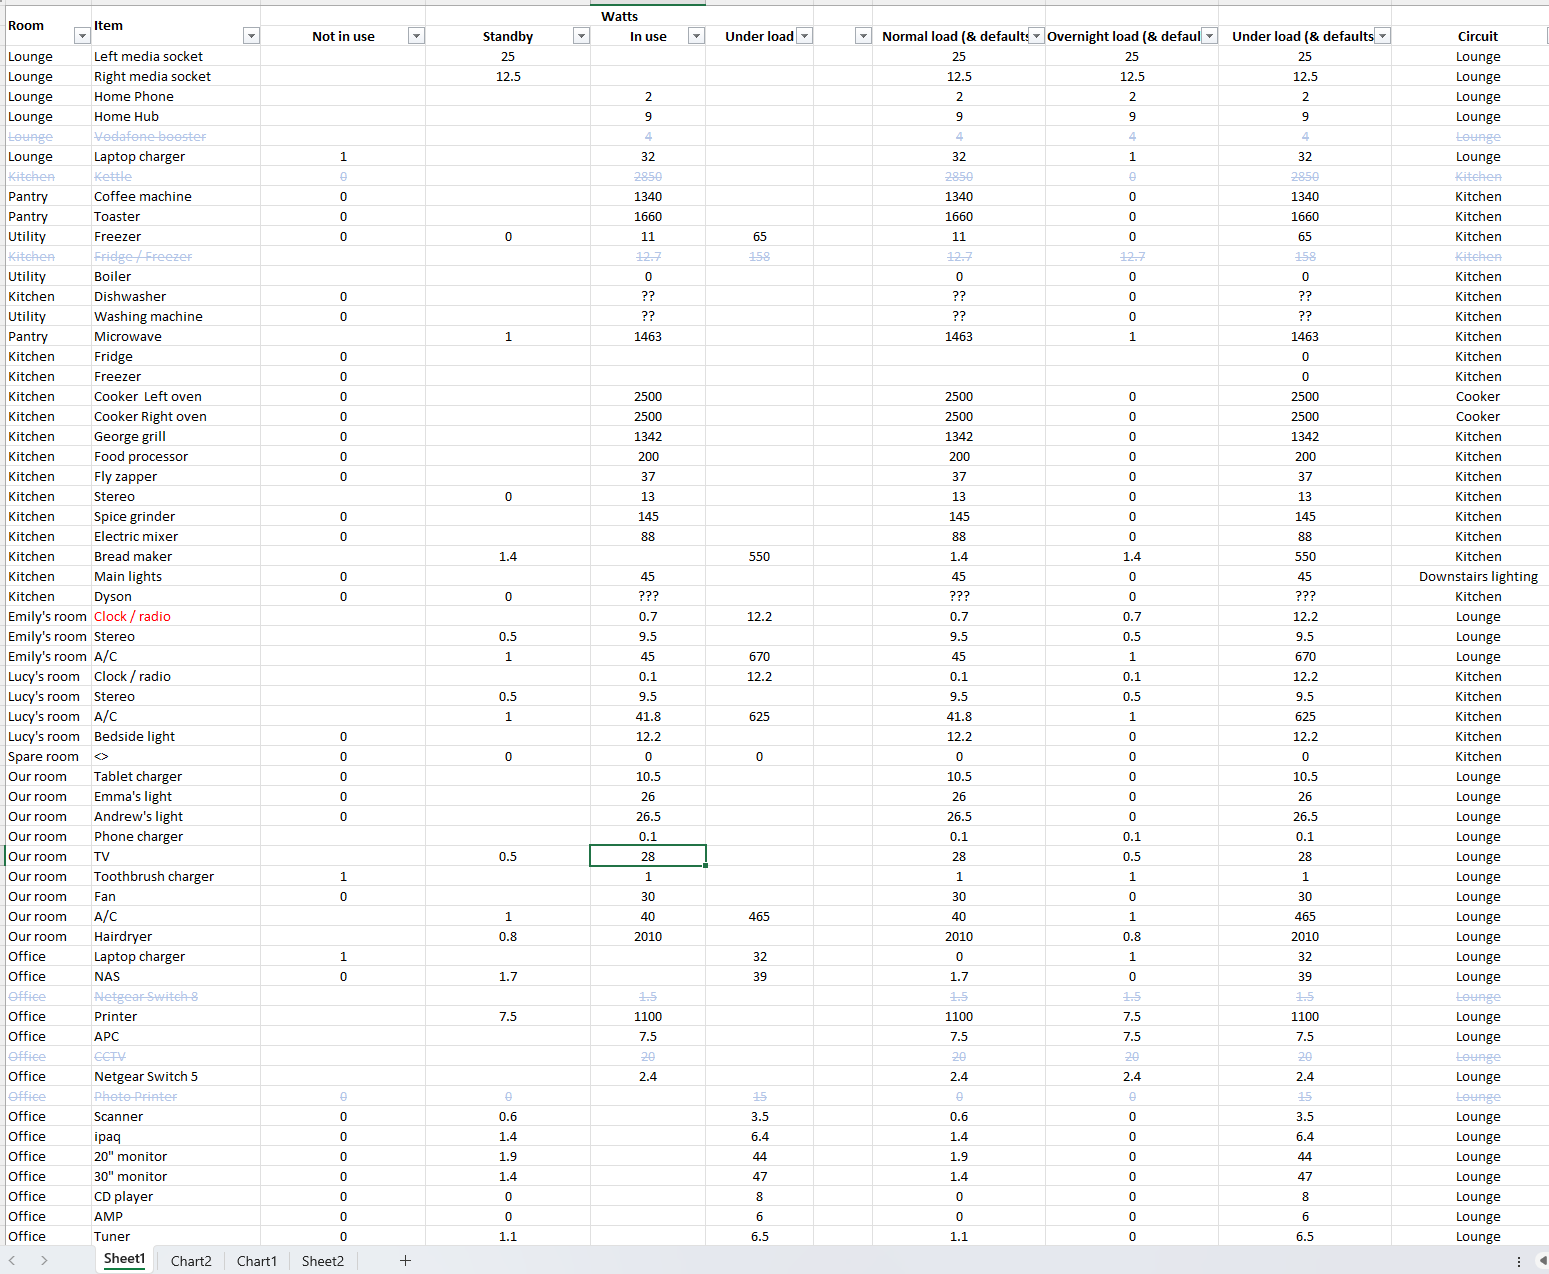
Do a spreadsheet like I did. It helps you find any anomalies
Snap, 3 years ago:
We got our 6,500kWh a year down to 4,450kWh with a few tweaks and a couple of changes.
Halogen outside lights changes to LED
Inside CFL lights to LED
Switching off loads of things on standby for days at a time.
Shouting at kids
Setting main PC to sleep after 10 mins rather that 24*7
Changing a SFF pc to a Raspberry pi4
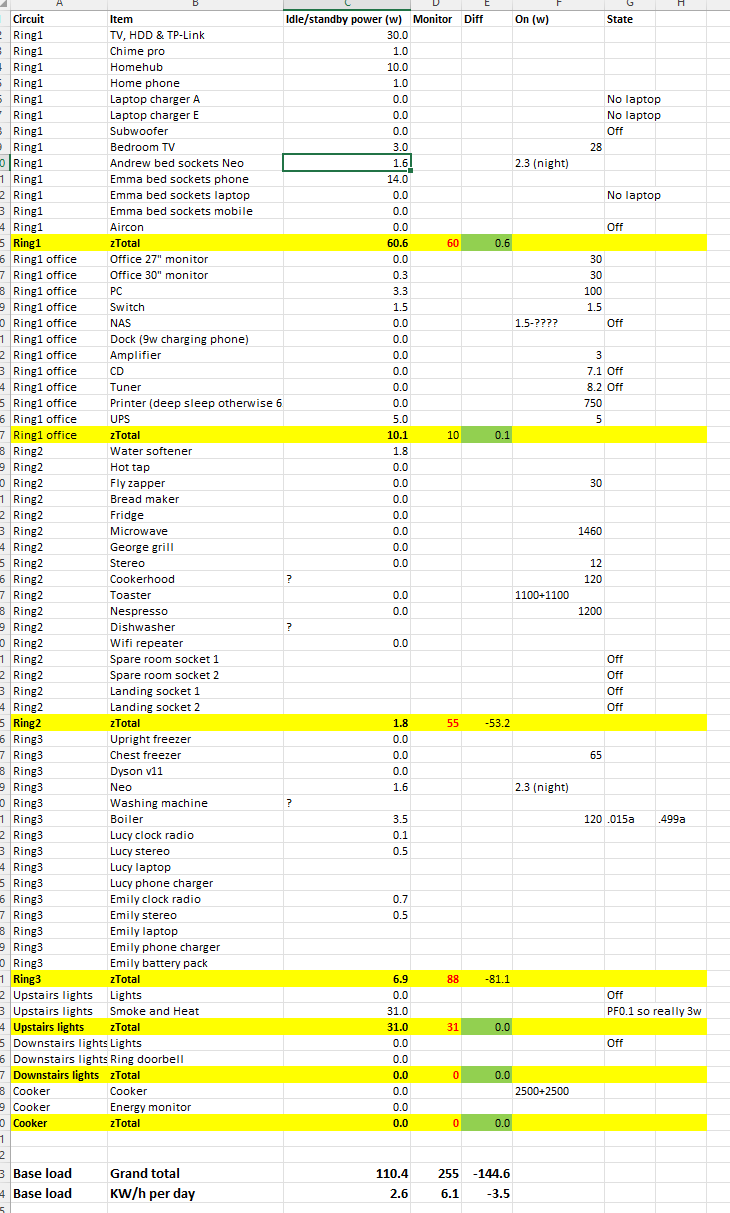
and by CU circuit:
Hot water tap doing it’s thing every hour over night:
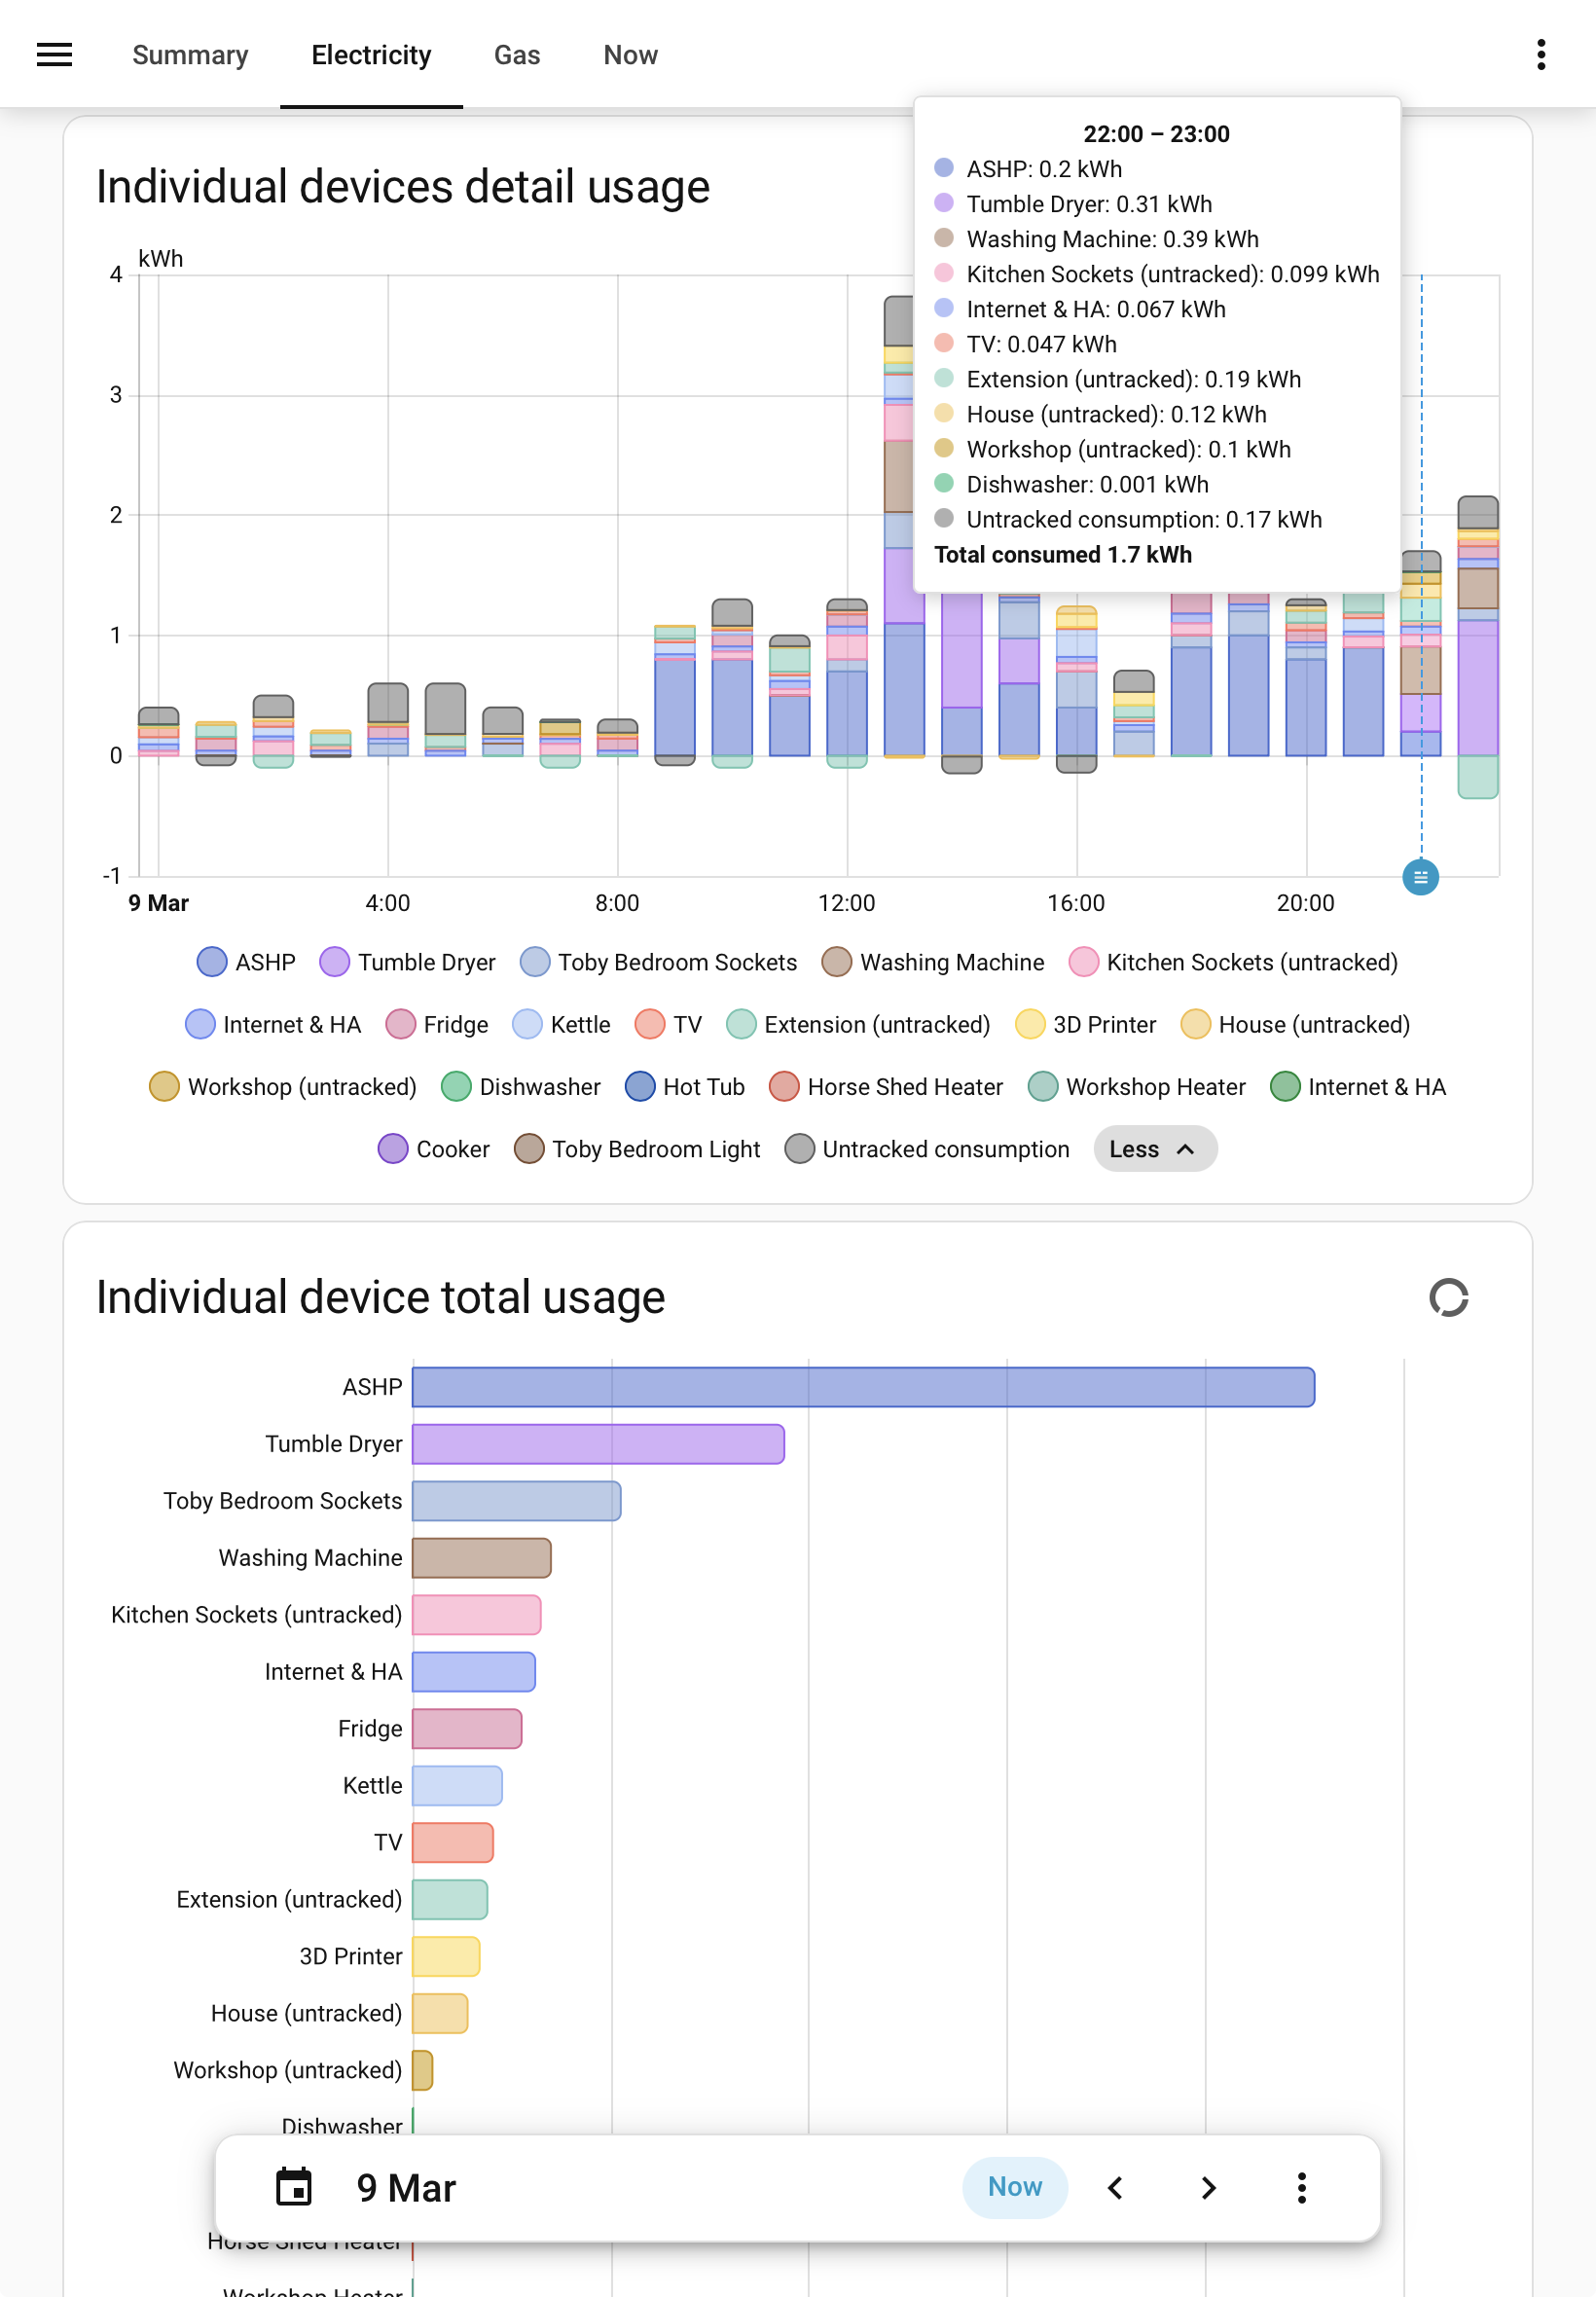
tracking down energy consumption, adding more smart plugs and CT clamps to circuits can become quite addictive
No surprises that that the heat pump and tumble dryer use the most, the PC I run home assistant on uses quite a bit (over a kWh a day), the washing machine was a surprise as that’s quite economical.
Hi Geoffrey, What do you use to generate those outputs/displays. And how does it gather its data?
Those are produced from the Energy dashboard in Home Assistant.
I have Home Assistant running on a computer, principally to control my inverter battery charging (via GivTCP with Predbat), but once you start seeing what your home is consuming it can become a drug to want ever more insights!
I’m principally using two methods of measuring energy consumption:
- I have (now) four Shelly EM’s, each of which has two CT clamps, which I use to measure energy in a specific circuit, our heat pump, the FIT solar array generation, the cooker, etc
- Smart plugs to measure individual appliances. I use ones from MyLocalBytes as they are a UK company and are rated to 16A so can be safely used for tumble dryer, washing machine, cooker etc
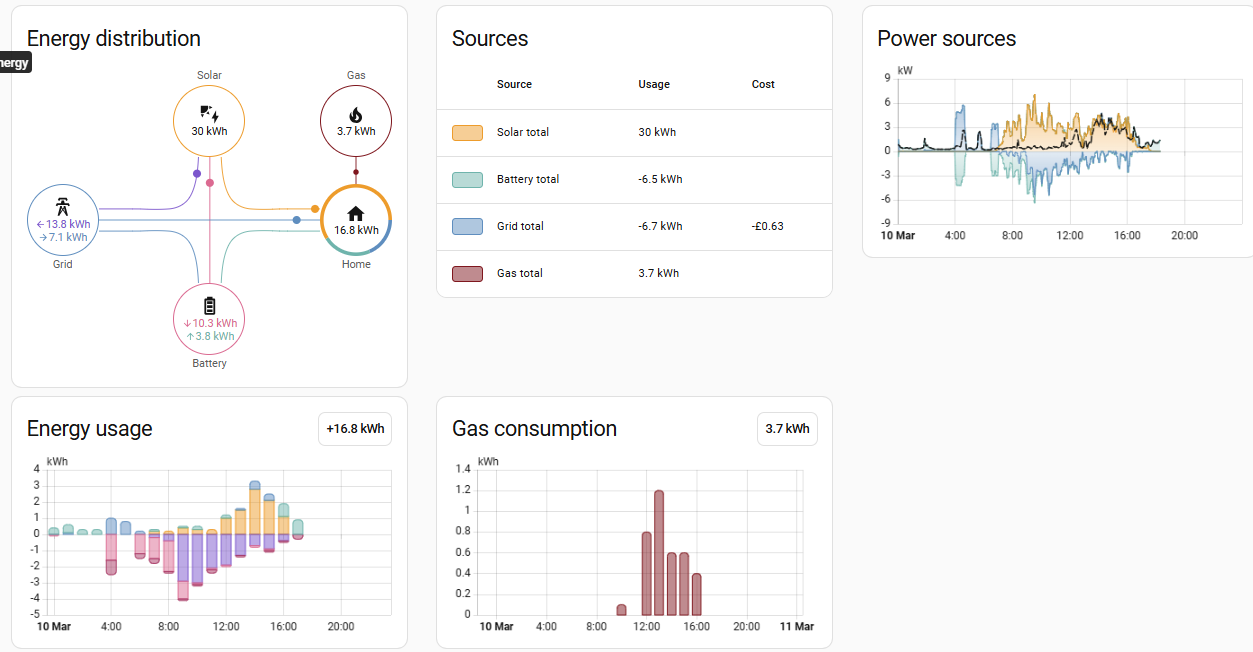
You can get lots of different graphs in Home Assistant, like this (gas=my heat pump)
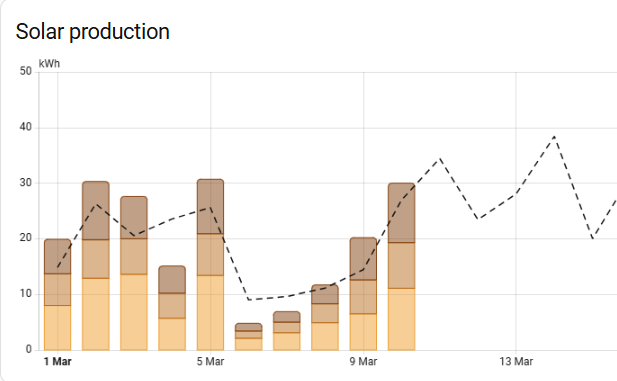
Solar generation vs forecast:
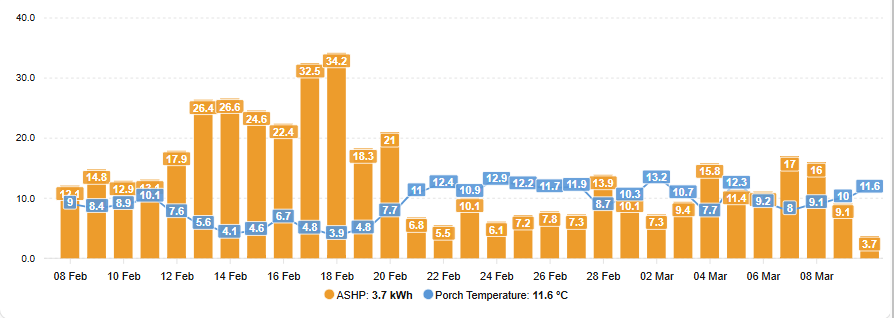
And you can easily create your own graphs, such as heat pump consumption vs outside temperature:
Thanks for that Geoffrey. Not sure I’ll be following you down such an intense journey of discovery! But very interesting.